Hemisphere plots of gridded parameters
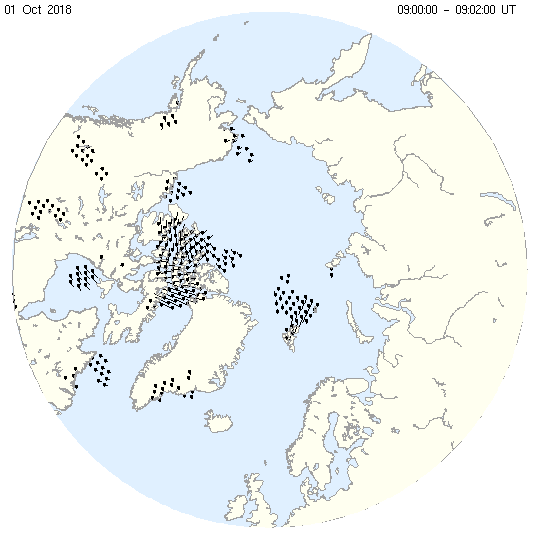
Getting started
grid_plot -x -delay 0 -raw -st 09:00 -time -coast -fcoast 20181001.north.grd
This code plots gridded line-of-sight ("raw") velocity vectors onto a map.
-xplot the data in an X-terminal-delay 0pause the frame until a mouse button is pressed, then the next interval will be plotted. UseCtrl+Cto exit.-rawplot raw line-of-sight velocity vectors-st 09:00generate plots beginning at time 09:00UTtimedisplay the date and time in the figure window-coastdraw coast outlines-fcoastfill the continents with default colors
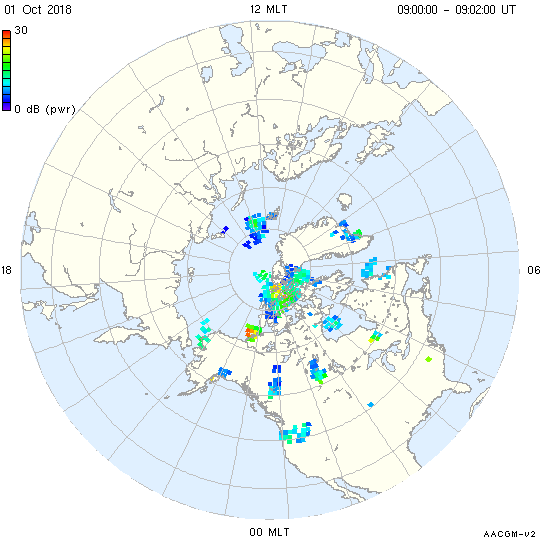
Plotting gridded power or spectral width
Grid files generated using the -xtd option in make_grid include the power and spectral width parameters in addition to the line-of-sight and merged velocity vectors. You can plot the power and spectral width using the -pwr and -swd options respectively.
Example:
grid_plot -png -ex 00:02 -st 09:00 \
          -coast -fcoast -rotate -latmin 30 -mag -grd -grdontop -tmlbl -time \
          -pwr -pmax 30 -xkey rainbow.key -xkeyp \
          20181001.north.grid2
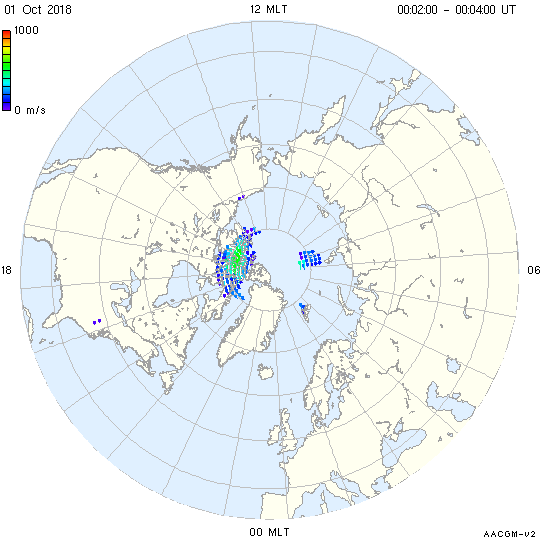
Multi-plot time-series
The grid_plot routine can also output a series of plots which can then be combined into a movie. For example,
grid_plot -png \
          -coast -fcoast -rotate -latmin 30 -mag -grd -grdontop -tmlbl -time \
          -raw -vkey myRSTvelcolorkey.key -vkeyp \
          20181001.north.grid2